Dashboards built on the numbers you already have. One set of figures, for everyone who decides.
We build dashboards and scheduled reports on top of your own databases and systems: a view for leadership and a view for each team, refreshed without anyone assembling them.
- Built on
- Your databases and the APIs of the systems you run
- You get
- A leadership view, team views and scheduled reports
- First dashboard
- One to two weeks on a single, clean source
A working sample, not a screenshot
This one runs on sample data for an order operation. Switch the view: leadership sees how the business is doing, the operations team sees where to act. Yours would read from your own systems.
Orders shipped per week
Show as a table
| Week | Orders shipped per week |
|---|---|
| Week 1 | 352 |
| Week 2 | 368 |
| Week 3 | 361 |
| Week 4 | 389 |
| Week 5 | 402 |
| Week 6 | 395 |
| Week 7 | 410 |
| Week 8 | 398 |
| Week 9 | 421 |
| Week 10 | 417 |
| Week 11 | 439 |
| Week 12 | 460 |
Orders shipped by region
What makes a dashboard get opened
- Every metric has an owner
- A metric nobody owns is a metric nobody acts on. Before we draw anything, each number is tied to the decision it supports and the person who makes it.
- The same numbers at two heights
- Leadership and each team look at the same data, cut for what they decide. Nobody argues about whose spreadsheet is right.
- It refreshes itself
- The collection behind the dashboard is automated, so the numbers are current without anyone assembling them. That is what decides whether it is still accurate in six months.
- Reports for people who will not open it
- Some people want it in their inbox on Monday. Scheduled reports go out from the same numbers, so the email and the dashboard never disagree.
We are not tied to one tool
Which one is right depends on what you already run and who will use it. We choose with you in the planning step, not before it.
A BI tool you already pay for
If your company already has one, we build there. Your team keeps the logins and the skills it has, and there is nothing new to host.
An open-source BI tool, set up for you
When you want people to explore the data themselves and do not want a licence for every seat. We set it up, connect it and hand it over running.
A dashboard we code ourselves
When it has to live inside your own product or portal, follow your own permissions, or do something no off-the-shelf tool does. This is how the dashboards in our own products are built.
Dashboards we have shipped
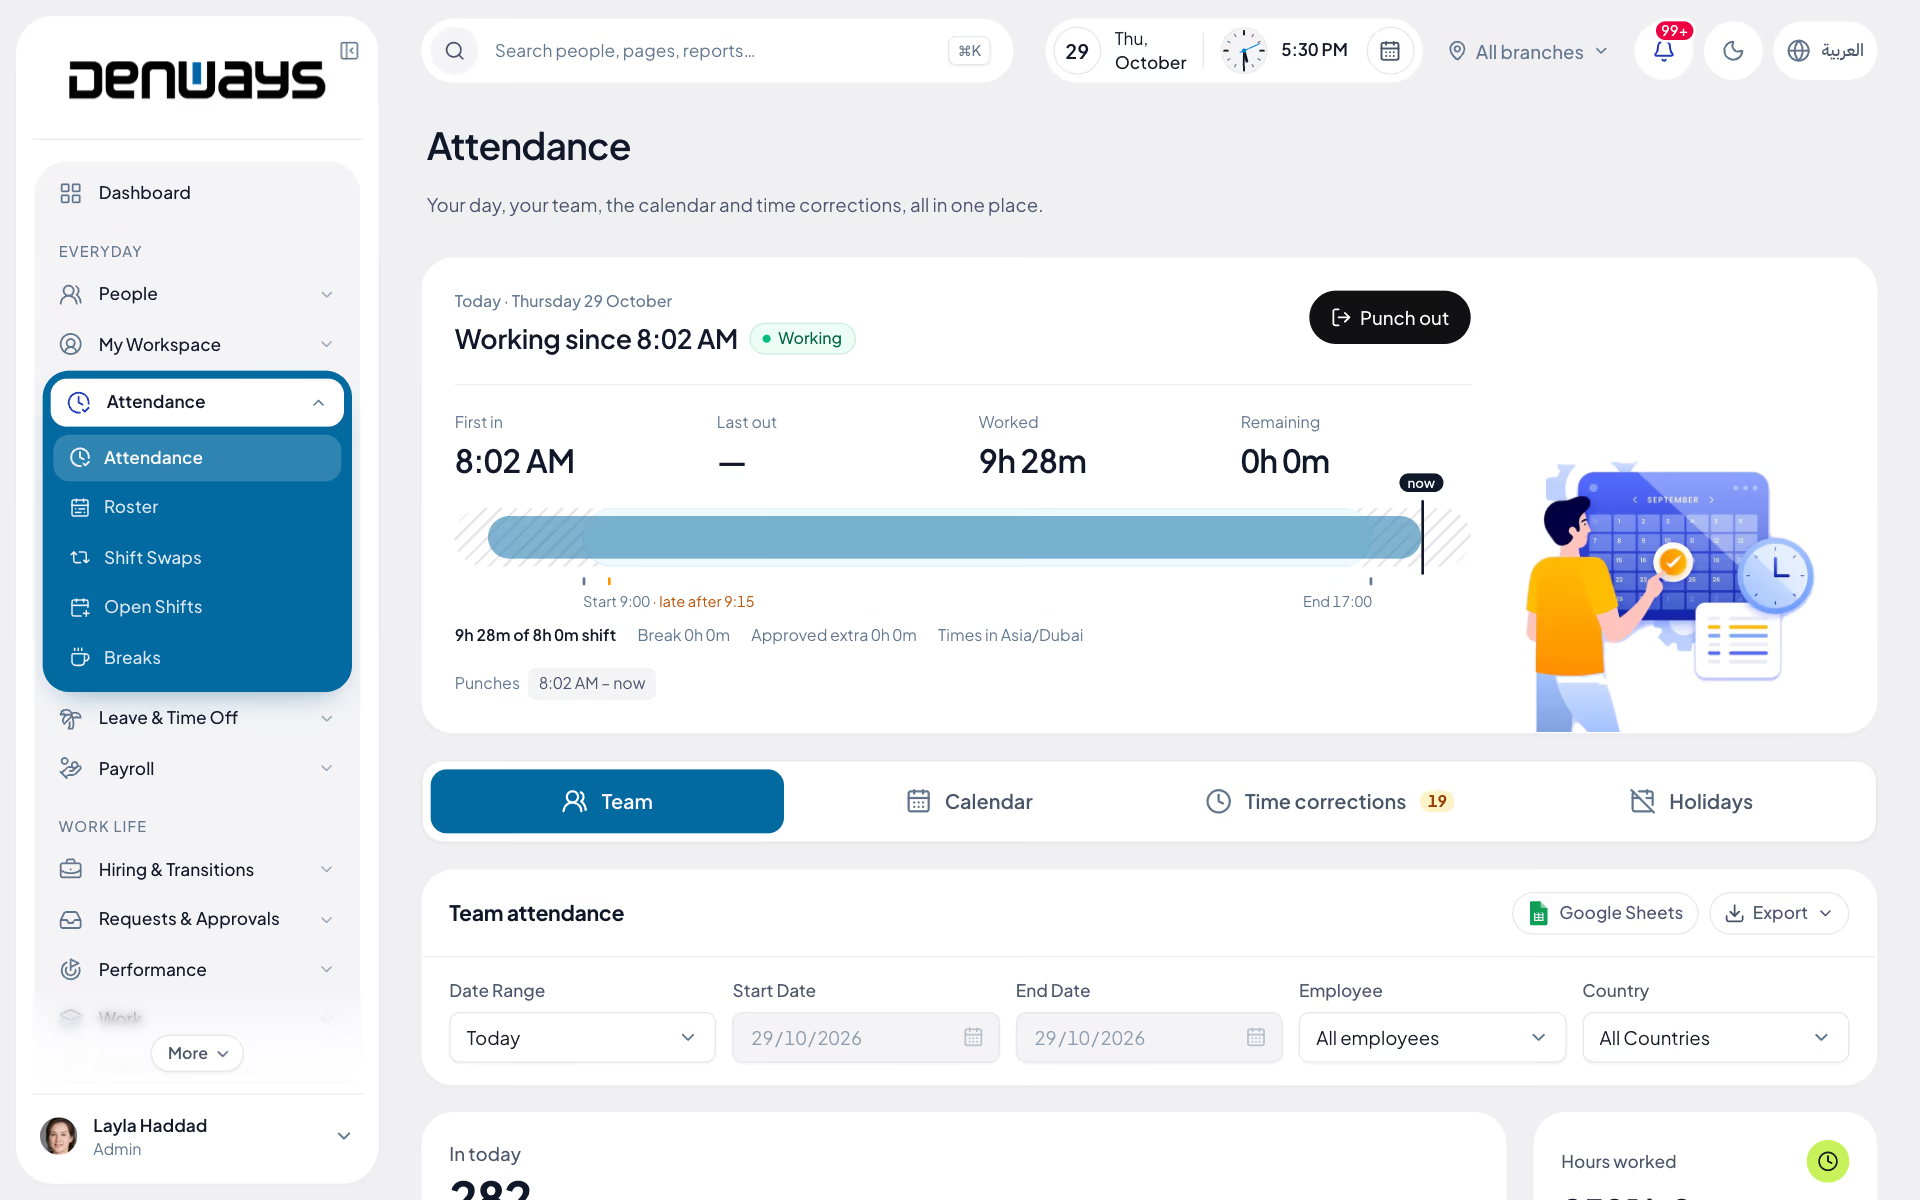
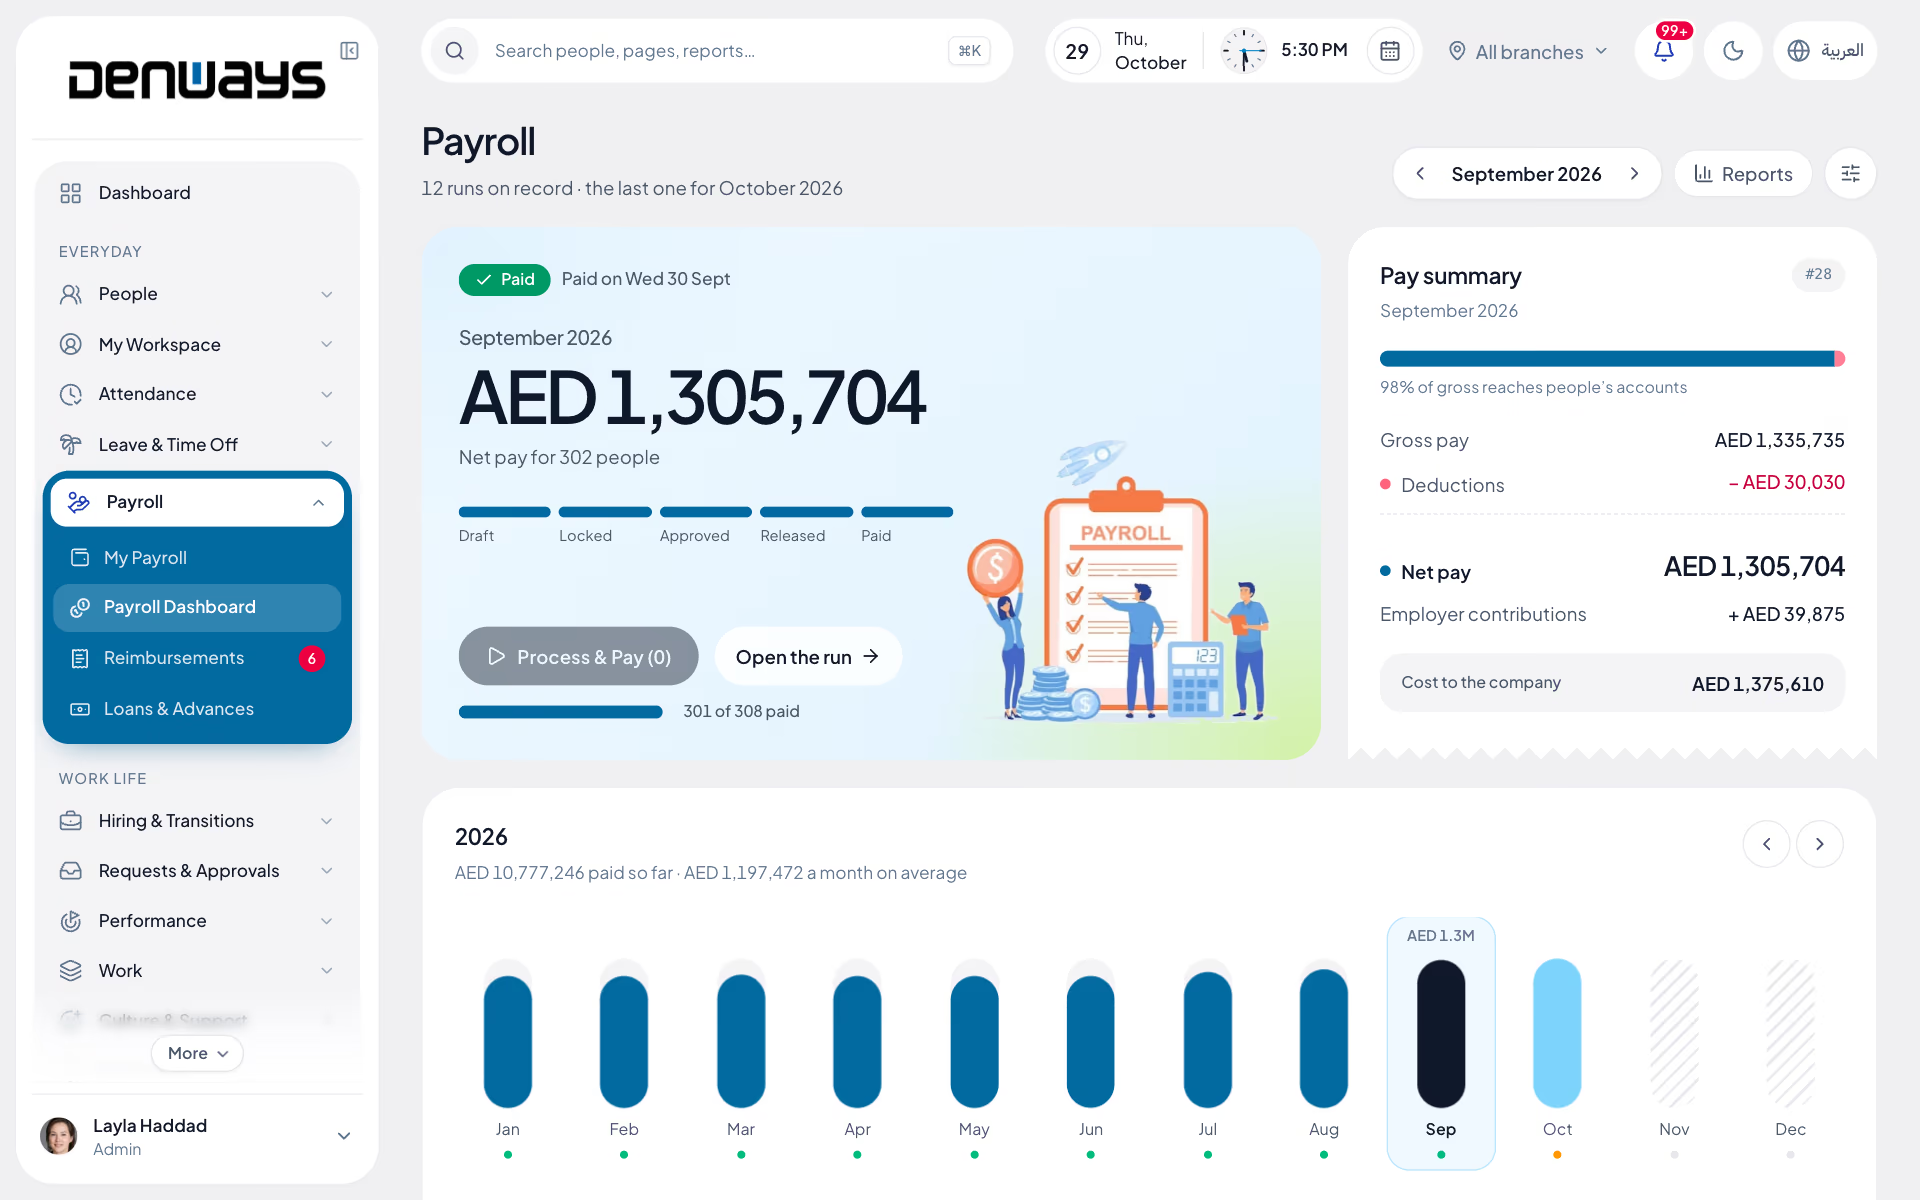
The ones we can show you are inside our own product. DenwaysHR reports on attendance, leave and payroll from the same employee record as everything else in it.
Questions about dashboards
The pipeline behind them is its own piece of work. Automated collection and all of it together is business intelligence services
What can it read from?
Your databases and the APIs of the systems you already run. If some of the data only exists on paper or in someone's head, the first job is capturing it, and we will tell you that before anything else.
How long does a first dashboard take?
One to two weeks for a first dashboard on a single, clean source. More sources, or data that needs cleaning first, take longer, and we tell you before we start.
What if our numbers do not agree with each other today?
That is normal, and it is what the discovery step is for. We find where they diverge before building, because a dashboard on top of disputed numbers only moves the argument.
Do we need a data team to run it?
No. You explain what you need to decide and we handle the technical side. It helps to have one person on your side who knows where the numbers come from.

Tell us which numbers you wait for.
Send a few lines about what you report on today and how it gets assembled. We reply within one to two business days.